Air cargo continued its ‘gradual but consistent recovery’ in July
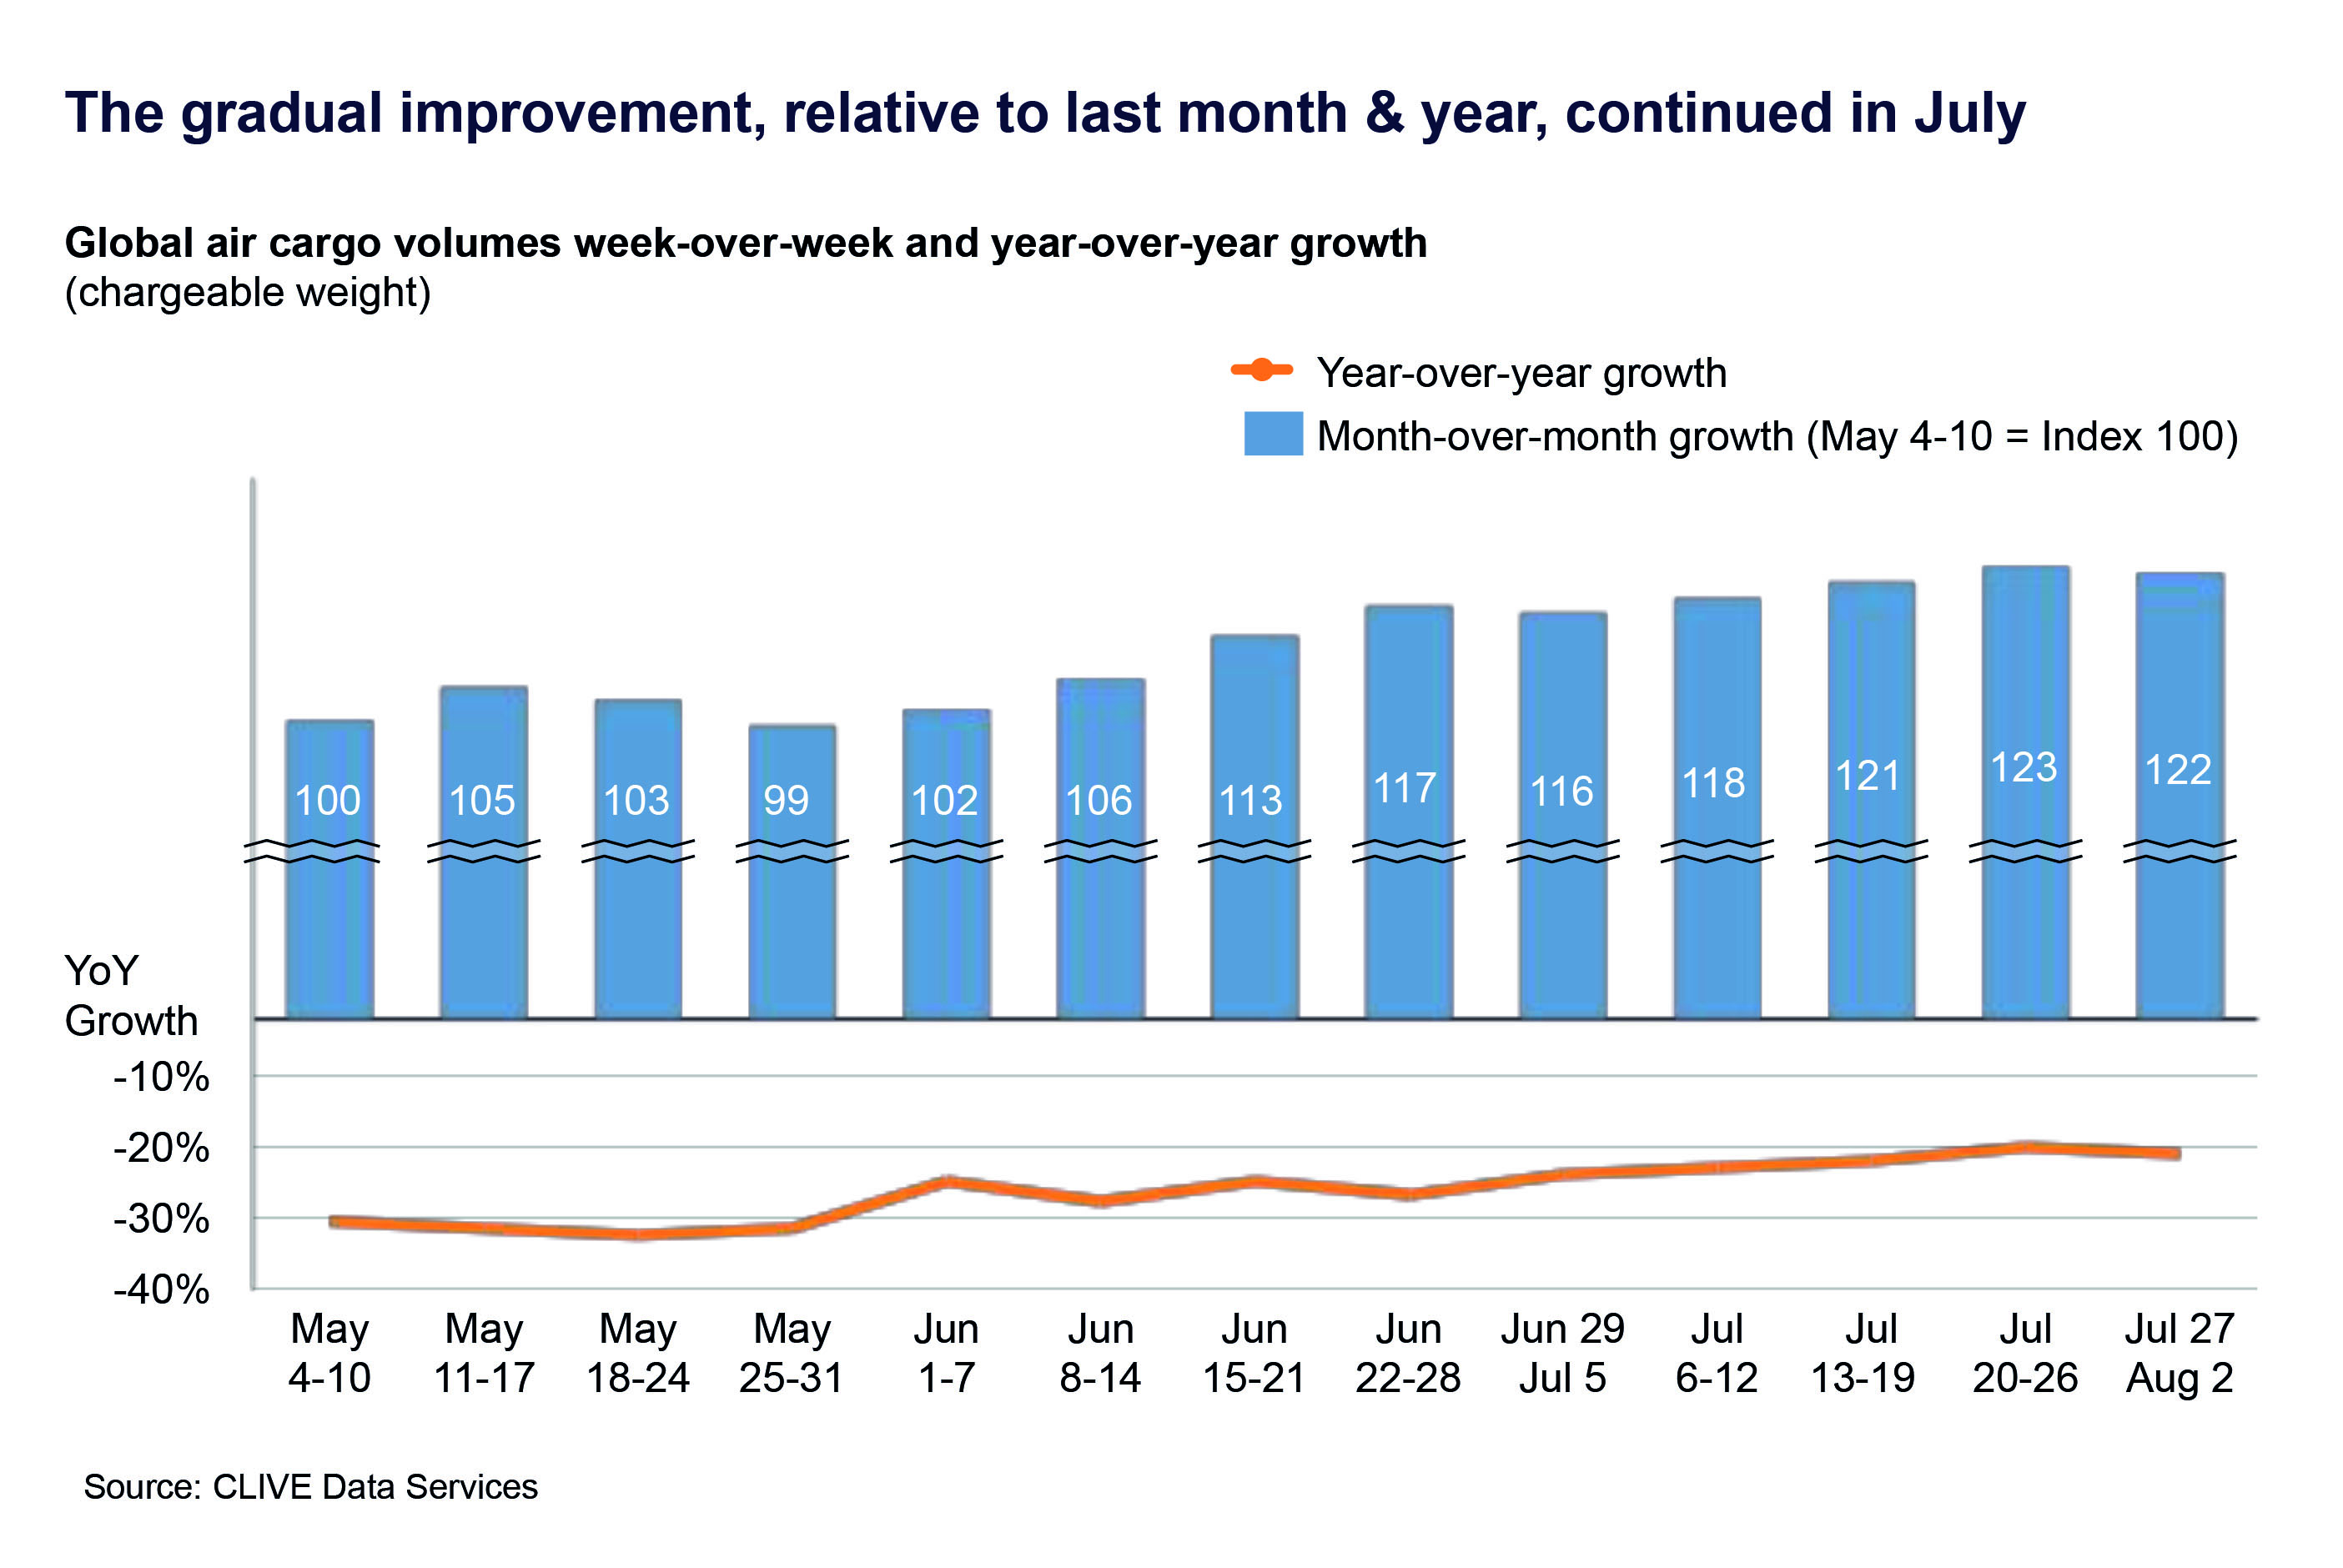
Global air cargo volumes continued to show a ‘gradual but consistent’ month-on-month recovery in July, increasing by 8% over June, according to the latest air cargo market analysis by CLIVE Data Services.
The growth in chargeable weight last month – normalised for the fact that July has one more day than June – also helped to further narrow the year-on-year decline in international freight volumes. July 2020’S performance was -20% versus the same month a year ago but still reflected an improving monthly trend in the level of air cargo traffic compared to the -26%, -31% and -37% year-on-year gaps in April, May and June 2020 respectively.
CLIVE’s regional year-on-year ‘dynamic loadfactor’ analyses, for example, for week 31 (Jul 27-Aug 2) shows:
• +21% points increase on the North America to Europe lane versus July 2019
• +19% points on the Europe-North America lane
• +10% points on the Asia-Europe & Middle East lane
• Closing of the gap on the Europe& Middle East-Asia lane, -5% points year-on-year but continually getting closer to the market level of 2019 after a seismic fall earlier in the year
CLIVE’s ‘dynamic loadfactor’ of 70% in July – based on both the volume and weight perspectives of cargo flown and capacity available -represented a minimal decline of 0.6% versus June 2020 but was still 8% higher year-on-year.
Managing Director, Niall van de Wouw, said: “Our market analyses for July, especially compared to what we were reporting a few months ago, shows the gradual but consistent climb up the slope to recovery for the air cargo market is continuing. This is obviously no ‘V’ shape recovery, but even as additional capacity comes into the market with the return of more passenger services, cargo volumes are showing some reassuring resilience. To put the 70% dynamic loadfactor into perspective, during the Christmas 2018 proper peak season it stood at 68%, and now we are in July, normally the doldrums summer period for the air cargo industry.
“Beneath this Global average are, however, regional differences. The load factors to and from Asia shows a different pattern than the ones across the Atlantic but this decline in load factor is mainly caused by increasing capacity. For example, Eastbound Atlantic capacity in the week of July 27-August 2 was 10% higher than in the last week of June, while the cargo volumes rose by ‘just’ 4% over that same timeframe.”
CLIVE’s air cargo industry intelligence consolidates data shared by a representative group of international airlines operating to all corners of the globe. Based on both the volume and weight perspectives of the cargo flown and capacity available, it uses weekly analyses to give the air cargo industry the earliest possible barometer of market performance each month.

About CLIVE Data Services
CLIVE’s ‘dynamic load factor’ analysis refreshes the way air cargo capacity usage is traditionally measured to reflect modern day reality. It is based on the fact that airlines’ cargo capacity nearly always ‘cube out’ before they ‘weigh out’ as a result of an aircraft’s higher capacity density (available kgs per cubic meter) than the average density of the goods moved by air. Consequently, CLIVE says, traditional load factors, based only on weight, underestimate how full planes really are, and thus give a distorted picture of how the industry really is performing.